Housing Composition & Disability
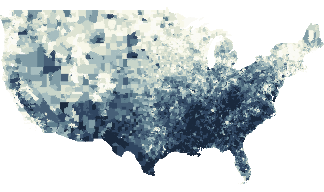
Population Aged 65 or Older
Ranking by percentage of the population aged 65 and older, average of 2014-2018.
Ranking by percentage of the population aged 65 and older, average of 2014-2018.
Pulling in 184 sets of data to rank more than 70,000 U.S. Census tracts, the U.S. Climate Vulnerability Index helps you see which communities face the greatest challenges from the impacts of a changing climate. This tool shows what is driving the challenges, so policymakers and communities themselves can take action to build climate resilience where it is needed most.